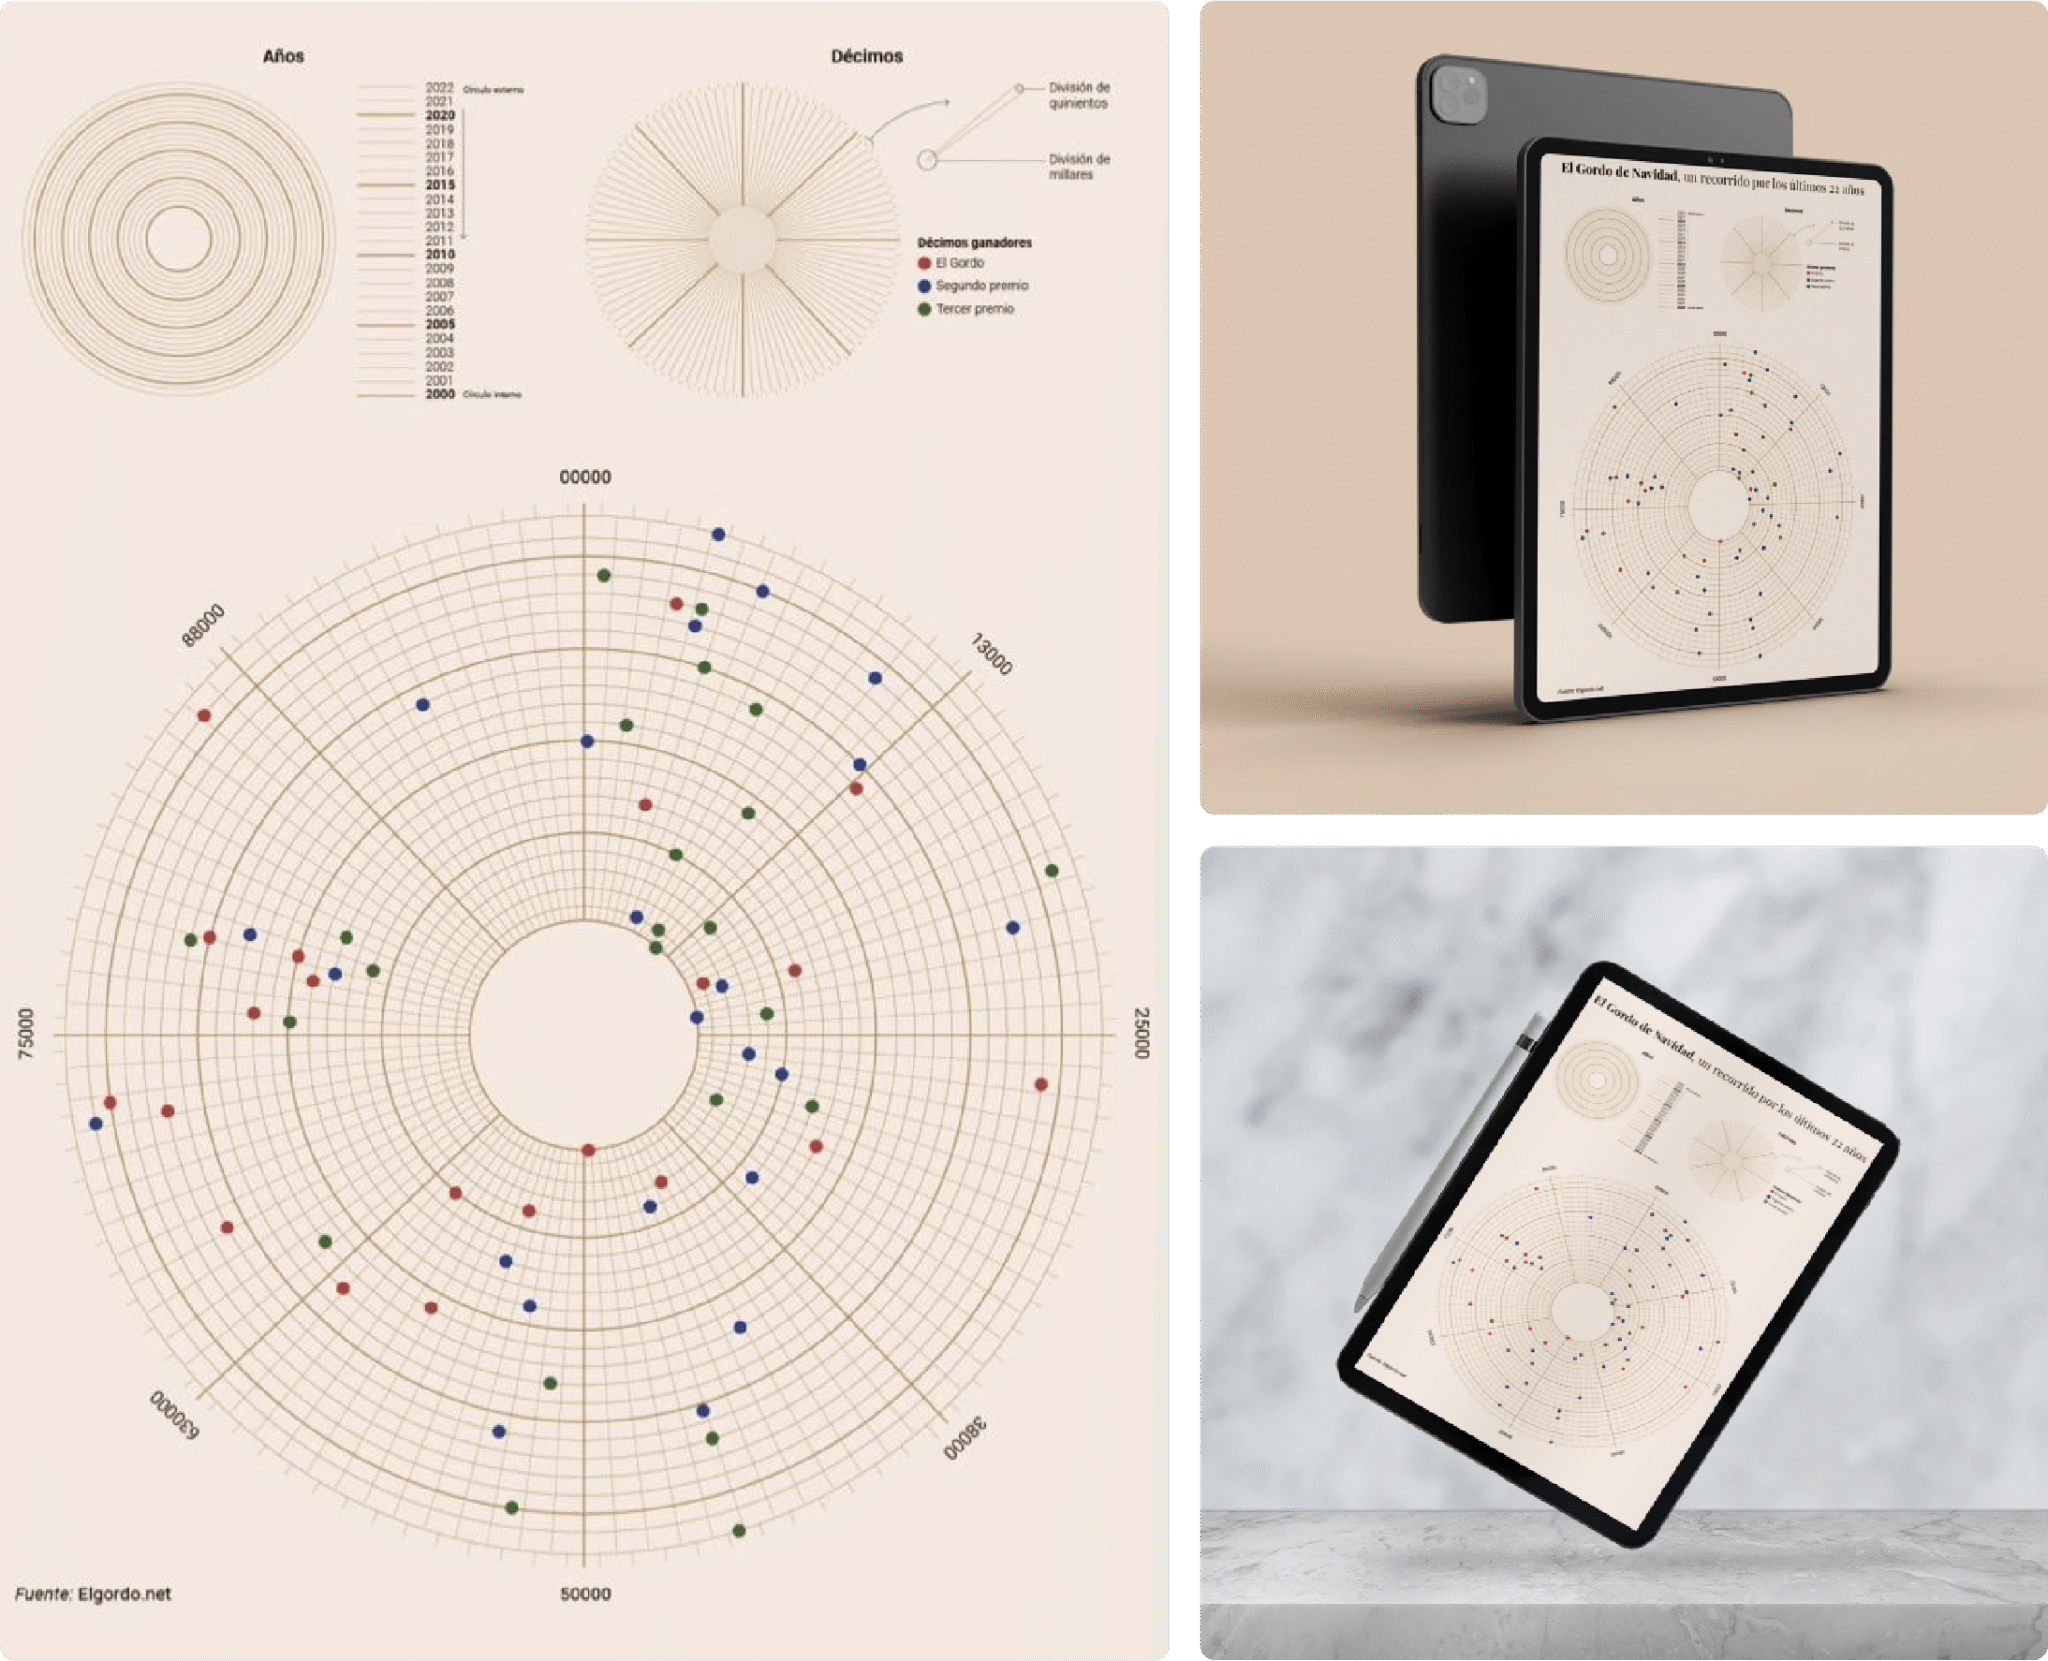
By encoding each draw’s year and winning number on the same grid, the chart reveals clusters, gaps and outliers that are hard to see in tables of historical results. The clean aesthetic and soft color palette keep the focus on patterns of luck and repetition, inviting viewers to explore how chance behaves over more than two decades of draws.